Introduction
Tuesday, Apple (AAPL [1] ) is set to announce earnings for fiscal Q3. At the most recent earnings release, Apple provided revenue guidance of $33.5 billion to $35.5 billion and gross margin of 36% to 37%. In this article I will try to assess whether its forecast was too conservative, too optimistic or whether I expect it to come true.
Estimating revenue
The most important element to assess in the forecast of Apple's revenue is the amount of iPhones sold. Analysts estimate sales of 26.7 [2] million, and at first that estimate seems a bit contrastive as it doesn't imply any growth from the same quarter last year.
If you look at the below table you can see how iPhone sales historically have been divided over each quarter. Typically, sales are lower in the release quarter since new iPhone models are released at the very end of the quarter. The iPhone 4 had its best quarter in the 3rd quarter after the "launch quarter", while both the iPhone 4s and the iPhone 5 had their best quarter in the 1st quarter after the "release quarter".
(Click to enlarge)
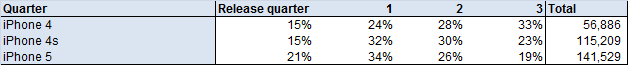
Source: Apple's earnings releases
For fiscal Q3, the implicit assumption behind the 26.7M figure is that sales will only total 19% of total iPhone sales over the last twelve months.
This is indeed a conservative estimate, but it is important to note that consumer behavior have changed over the last couple of years. In general, it seems that consumers today are more inclined to buy the new iPhone as soon as possible while they were more inclined to delay their purchases 2-3 years ago.
Further, I also believe it is likely that some consumers will wait with purchasing an iPhone due to rumors of a new budget iPhone hitting the shelves very soon. Thus, I believe that analysts are pretty accurate with their estimates.
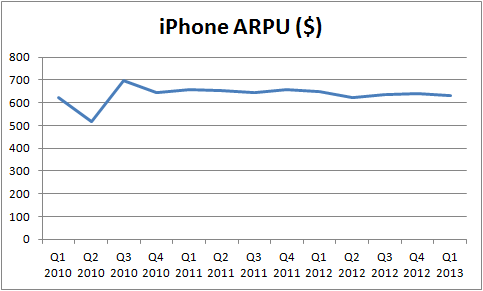
By using the 26.7 estimate, we can calculate the revenue of the iPhone business segment by multiplying it with an estimate for the average selling price. In the below graph, we can see that the average selling price has been very constant over the last couple of years, and I expect an ARPU of $620 for this quarter. This results in iPhone revenue of (620*26.7) $16.5 billion
(Click to enlarge)
To make it easier to forecast the revenue of the iPad segment, I like to keep sales estimates of the iPad Mini and the 10-inch iPad separate. In the below graph, the historical sales figures can be seen.
(Click to enlarge)
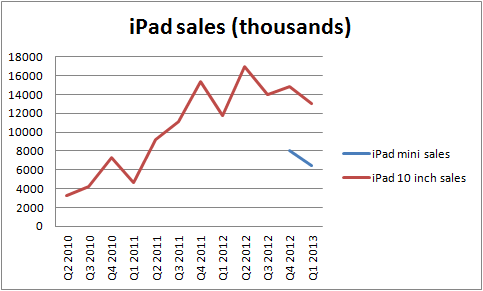
Source: Apple's earnings releases and my own estimations
Three conclusions can be made based on the above graph;
- The iPad Mini has cannibalized sales of the 10-inch iPad
- The introduction of the iPad Mini has led to higher total iPad sales
- Sales of the iPad Mini are roughly 50% of sales of the 10-inch iPad.
This June quarter is a bit challenging to provide forecasts for as it differs quite a bit from previous June quarters for two reasons;
- Instead of introducing a new iPad in the June quarter, Apple introduced a new iPad model in the December quarter last year. This means that there is no new iPad model for fiscal Q3 for the first time since the first iPad was released.
- On the other hand, Apple now has a larger product portfolio with the release of the iPad Mini, which means that it sells to a broader target group.
Since no new model has been introduced for fiscal Q3, chances are that sales have declined, and I expect iPad Mini sales of 5.5M and 10-inch iPad sales of 11.5M. By using an average selling price of $330 for the iPad Mini and an average selling price of the 10-inch iPad of $525, I obtain the following revenue estimates for the iPad business segment;
(Click to enlarge)
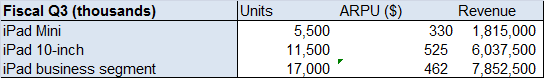
Revenue of $7.85B is below the $9.1B for the June quarter in 2012. That obviously doesn't mean the iPad segment is declining over the long term, but rather, that it currently suffers from lack of new products (and too some extent also from more competition).
But unfortunately for short-term Apple investors, it is not just the iPad and the iPhone segments which I expect to announce relatively mediocre sales figures, but Mac sales are also likely to decline. In a press release [3] from IDC, it was revealed that PC shipments had declined by 11.4%.
In order to assess how changes in global PC shipments affect Mac sales, I looked at historical correlations of the growth rates. In the below graph (which shows growth rates from Q2 2010 to Q2 2013), two overall trends can be seen;
- Mac sales have historically been more volatile than global PC sales
- The growth rate of Mac sales have historically been higher than the industry growth rate
(Click to enlarge)
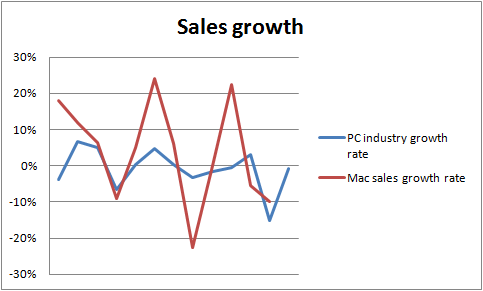
Source: Apple's earnings releases and IDC.com
So while the industry fell by 11.4% in the June quarter, I estimate that Mac sales will decline by "just" 4%. In terms of revenue, I actually estimate that it will be somewhat unchanged as Apple has increased its average selling price with the introduction of a more expensive Mac Book pro with retina display. Assuming the ARPU for the last quarter ($1378) is maintained, I estimate revenue of (1.378 * 3.865) $5.3 billion.
(Click to enlarge)
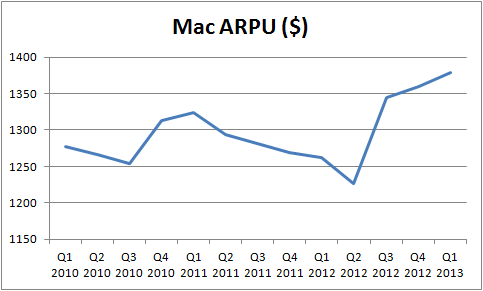
Source: Apple's earnings releases
The iTunes segment is Apple's fastest growing segment with a growth rate of 30% in the most recent quarter. Assuming the 30% growth rate continues, I expect Q3 revenues of $4.16B.
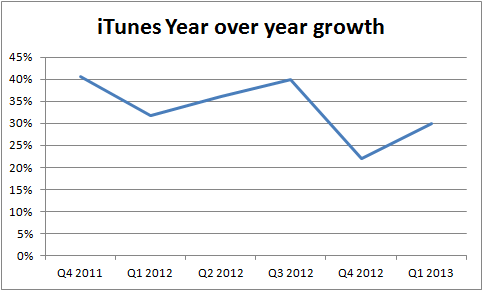
Source: Apple's earnings releases
Adding up all of the numbers, it can be seen in the below table that I expect revenue to decline to $36.5B from 43.6 in fiscal Q2. Compared to Apple's own guidance, I am actually quite optimistic as management only provided guidance of $33.5 to $35.5 billion

Forecasting Earnings
To forecast earnings, I multiply the expected gross margin with the expected revenue for each of the business segments. While Apple doesn't announce gross margins on a segment basis, they can (too some extent) be estimated by analyzing historical figures. To keep the article at a reasonable length, I won't fill up this article with a discussion of how I estimated the gross margins, but the numbers are provided below.

The iPhone business segment is not just the largest in terms of revenue, but also the most profitable. By combining my gross margin estimates with Apple's guidance for operating expenses and tax rate, I end up with an EPS of $7.78.
In that regard, I am a bit more optimistic than the average analyst that expects an EPS of $7.31 [4] .

Final words
Whether the EPS turns out to be $7.3 or $8 is actually less relevant for the stock price of Apple than the guidance that Apple will provide for fiscal Q4. Since Apple's management has the best knowledge of the cost structure and future product lineup, its guidance can move the stock price quite a bit. Analysts estimate revenue of $37.55 billion and EPS of $8.08 for fiscal Q4, and once again, I think it is likely that they are a bit too pessimistic.
I expect that the release of a budget iPhone, iPhone 6 (or 5s) and a new iPad in September will lead to higher revenue and income figures. Thus, I predict that Apple will provide a revenue guidance of $37.5-39.5B with a gross margin between 34 and 36% for fiscal Q4.
Disclosure: I have no positions in any stocks mentioned, and no plans to initiate any positions within the next 72 hours. I wrote this article myself, and it expresses my own opinions. I am not receiving compensation for it (other than from Seeking Alpha). I have no business relationship with any company whose stock is mentioned in this article.
No comments:
Post a Comment